Have you heard the good news about the excellent state of U.S. air quality? Chances are, you haven’t. In fact, it is much more likely that you’ve heard the opposite—glum stories of smoggy skies and unhealthy air constantly under threat from industrial pollution and SUVs.
Reality begs to differ. As we celebrate Earth Day, it’s worth acknowledging that by many key metrics, the U.S. has some of the cleanest air in the world, and steady improvements are continuing over the long-term.
Last year, we highlighted a report by a coalition of state regulators detailing the troubling disconnect between Americans’ pessimistic views on air quality and reality on the ground—or rather, up in the air. We wrote:
The report noted trends in Gallup’s annual polling on environmental issues, which in 1997 found that 42 percent of Americans worried “a great deal” about air pollution while another 34 percent worried “a fair amount.” Incredibly, 20 years later, Gallup’s 2017 survey found Americans more concerned about air pollution, with 47 percent worried “a great deal” and 31 percent worried “a fair amount.” As the chart below shows, during this period of continual public angst on the subject of air quality, pollutant emissions fell significantly even as population, energy use, and the economy steadily grew.
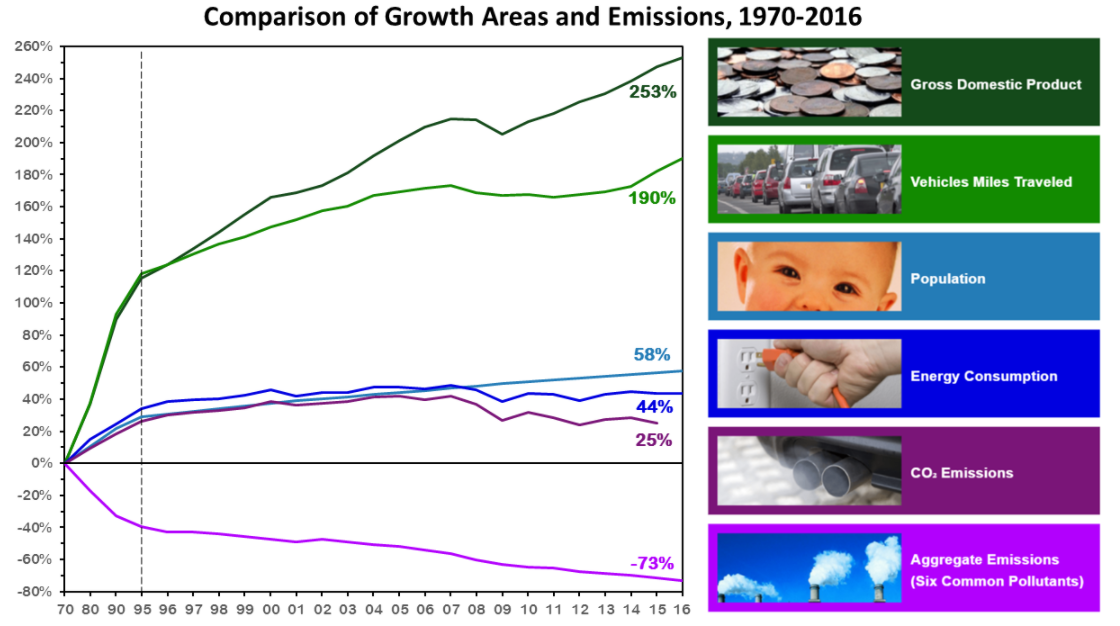
So what explains this disconnect? As the report noted, “With media more likely to report bad news combined with often apocalyptic framing by advocates and limited understanding of technical air quality information, it is no wonder that the public is often confused about air quality in their city, county, state, and nation.” That’s a gentle way of saying that Americans have been misled by the media and agenda-driven groups. This has led to a remarkable situation in which Americans are more concerned about the air they breathe than people in countries with off-the-charts air pollution. For example, the report notes that “The U.S. ranks behind countries like Bangladesh and Nepal in air quality satisfaction despite average fine particulate matter levels roughly 90 percent lower than these countries.”
This year, we decided to dig a little deeper, and examine some of these same trends on the local level. Using information from EPA’s air quality statistics database, we compiled data on ambient concentrations of several key pollutants (referred to as “criteria pollutants” by EPA) in a handful of major cities since 2001, and compared them to population and economic indicators (obtained from the Census Bureau and Bureau of Economic Analysis, respectively). The results are equally impressive:[1]
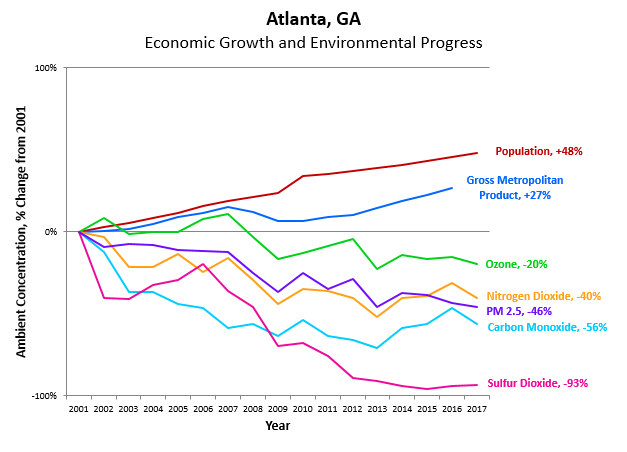
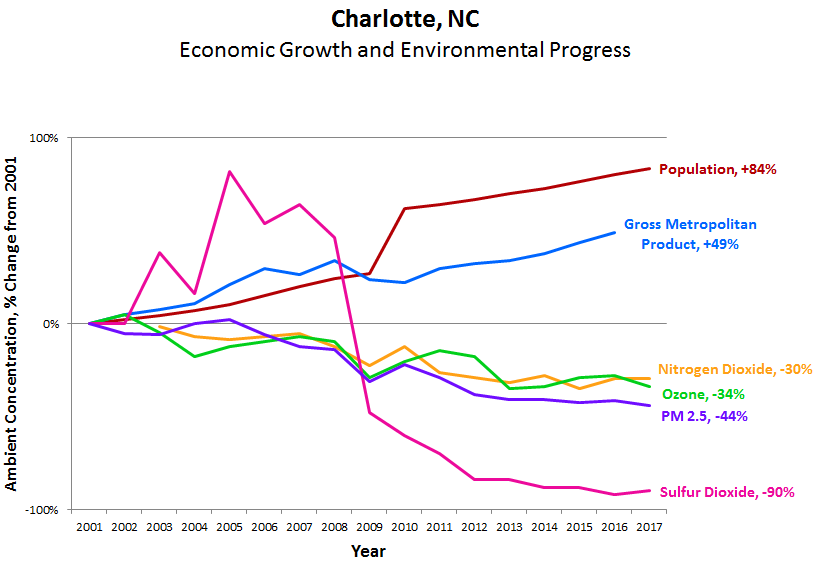
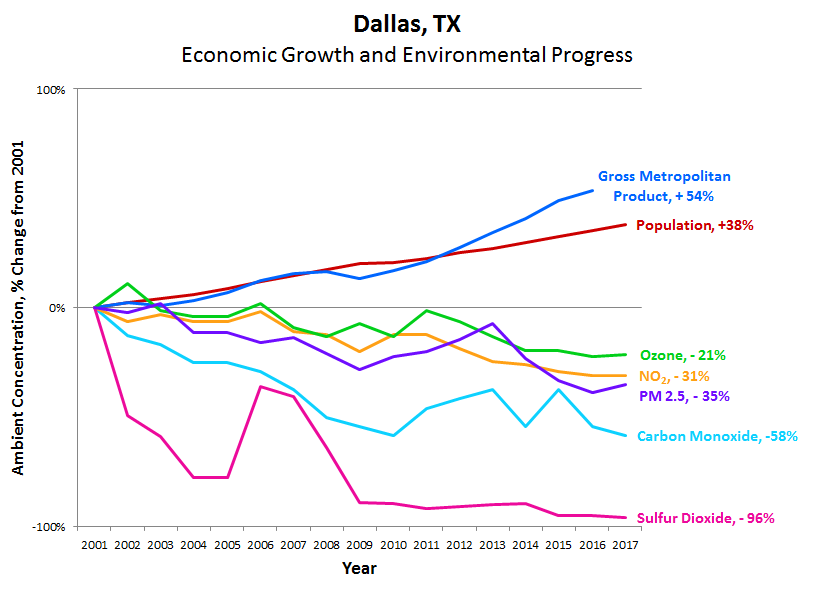
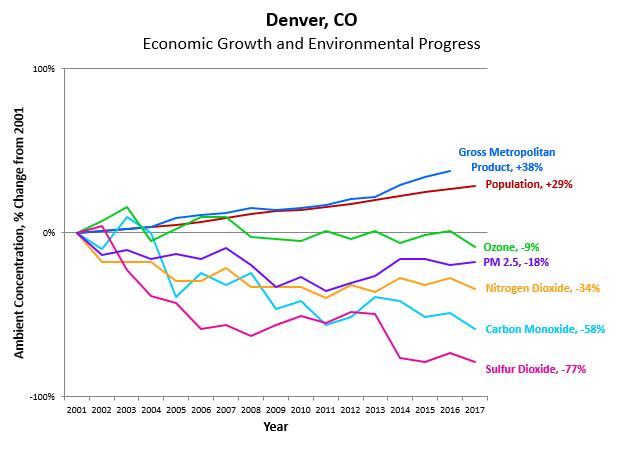
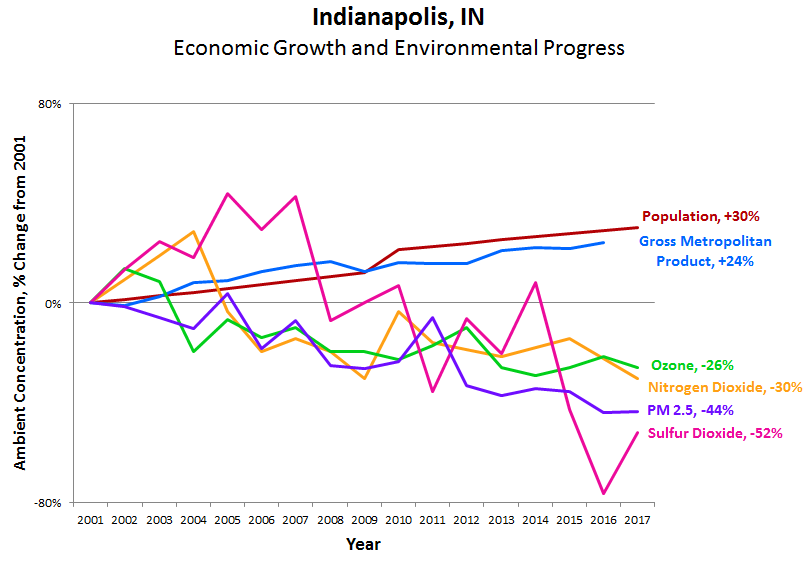
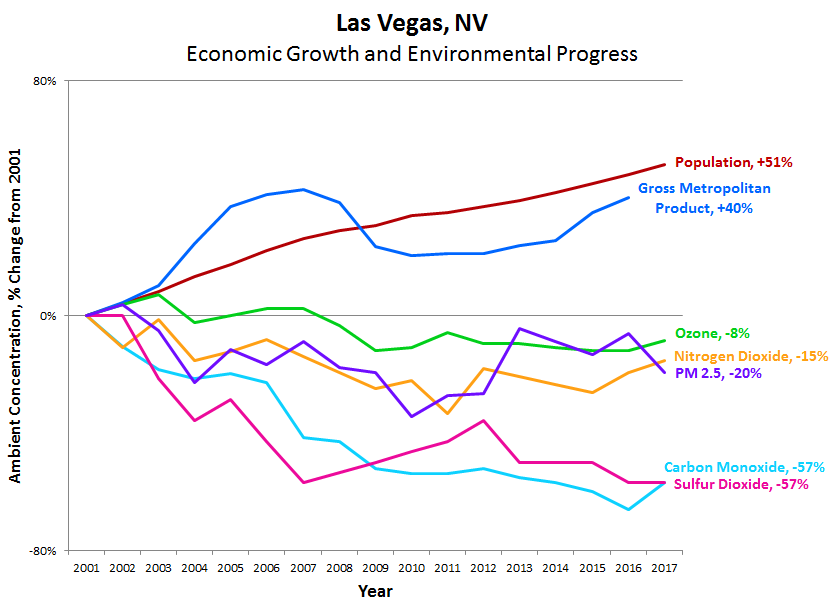
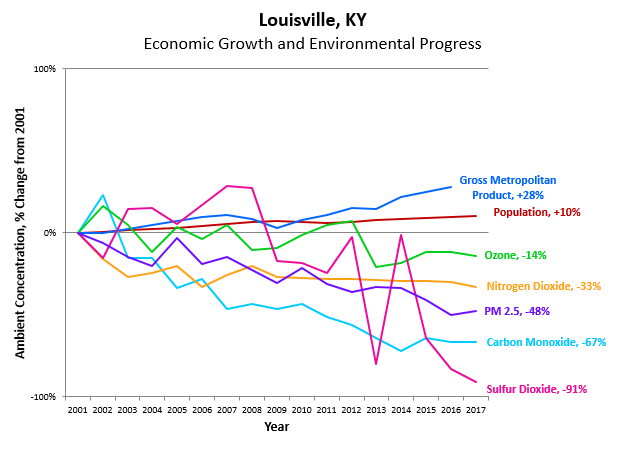

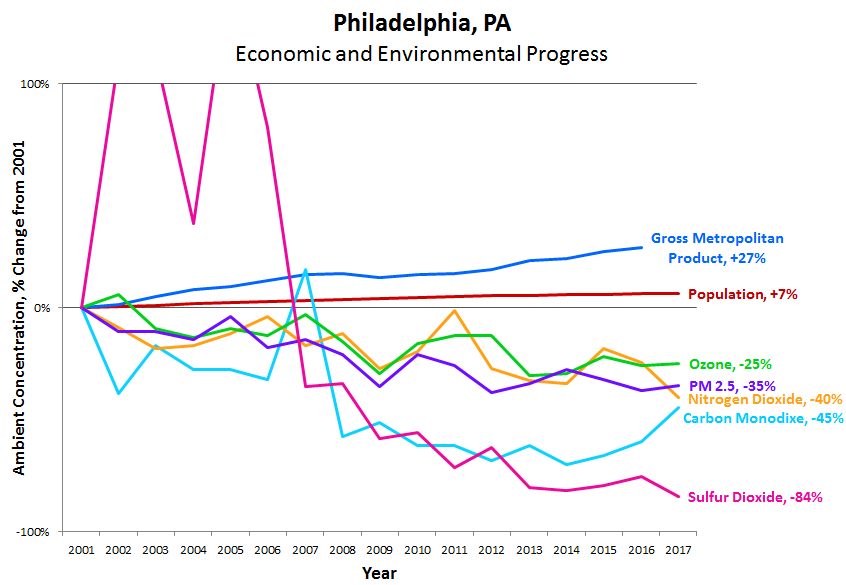
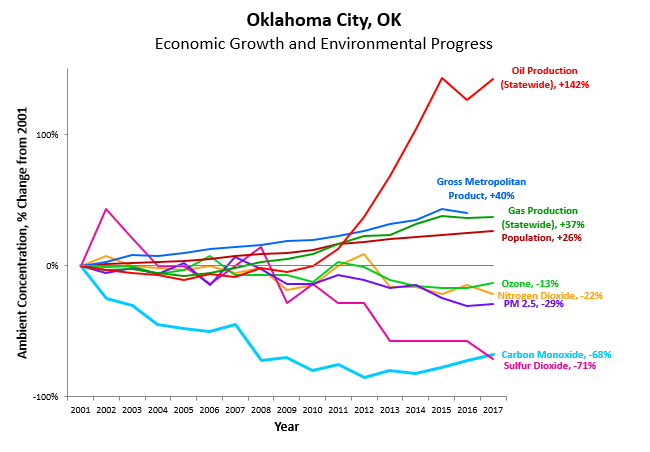

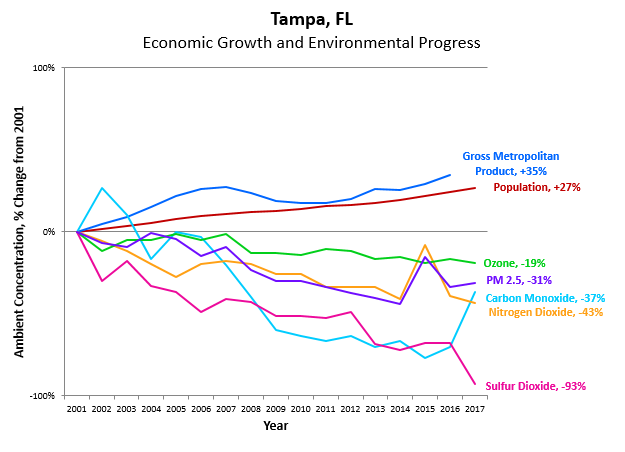
In each case, these cities were able to build upon the dramatic air quality improvements of the 1970s, 80s, and 90s with continued gains, all while experiencing steady economic growth. Such progress is always a challenge, but doing it while a growing population adds housing, vehicles, and industrial activity is a remarkable feat that deserves far more recognition and appreciation.
This good news story isn’t an accident, and it isn’t just the result of a few fortunate policies or innovations. These achievements are the product of a truly cooperative system involving EPA, states, industry, and environmental advocates working together on countless issues to advance technology and policy in a manner that fosters economic growth.
Of course, there is still more work to be done, but don’t be fooled the next time you see a gloomy headline painting U.S. air quality with a broad and disparaging brush.
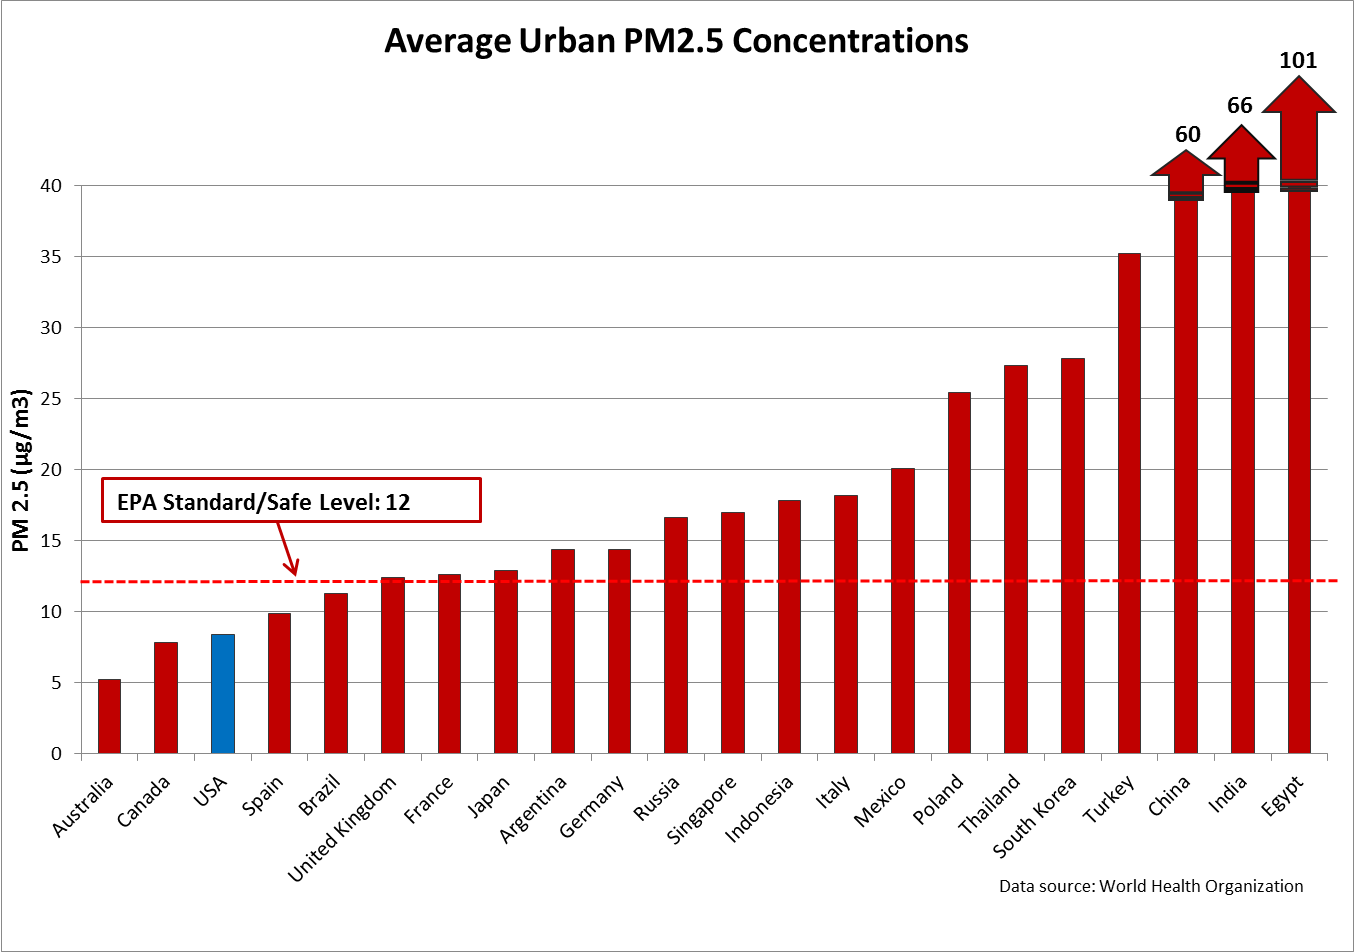
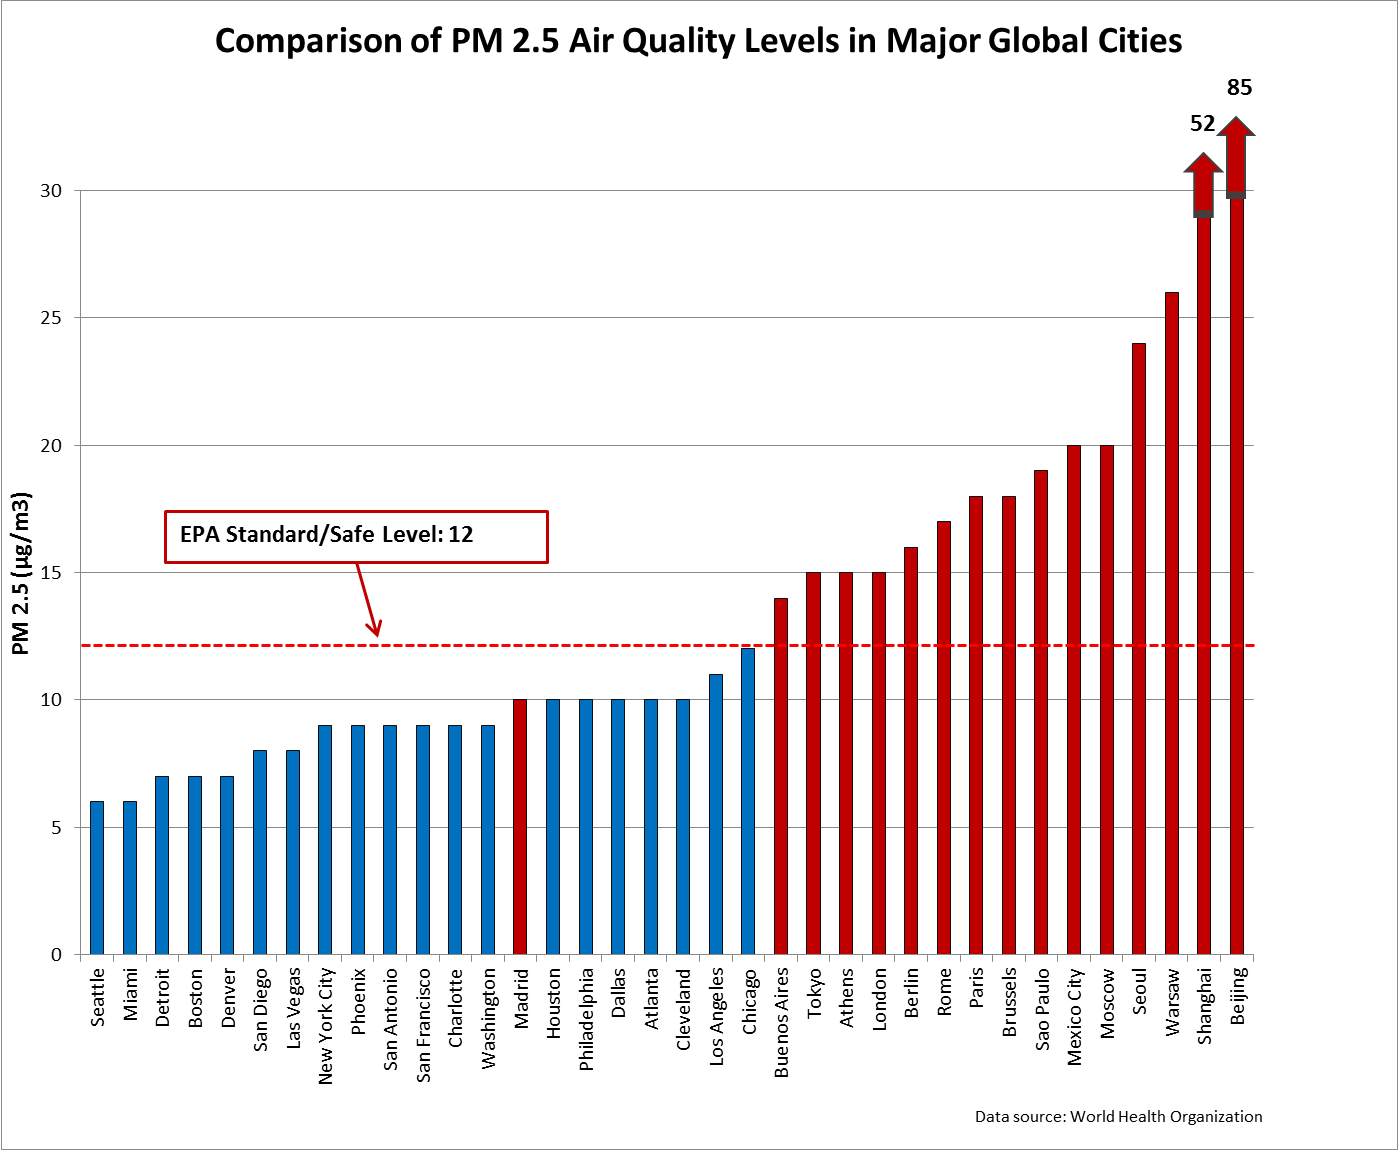
While we’re at it, if you’re interested in seeing how U.S. air quality stacks up against the rest of the world, check out these charts we compiled on World Health Organization data on particulate matter—a key indicator of overall air quality—in major cities and countries around the globe. The WHO data shows that most major global cities—including iconic European cities such as London, Berlin, Rome, and Paris—can’t hold a candle to the U.S., and in fact are at levels well above what EPA considers safe and protective of public health (PM 2.5 in major Chinese cities is quite literally off the chart).
[1] Data values taken from the following outputs of EPA air quality statistics reports: CO: 8-hour 2nd max; NO2: annual mean; Ozone: 8-hour 4th max; SO2: 99th percentile 1-hour; PM 2.5: 24-hour weighted mean. For some cities, incomplete or missing data limited data presentation.